Blog
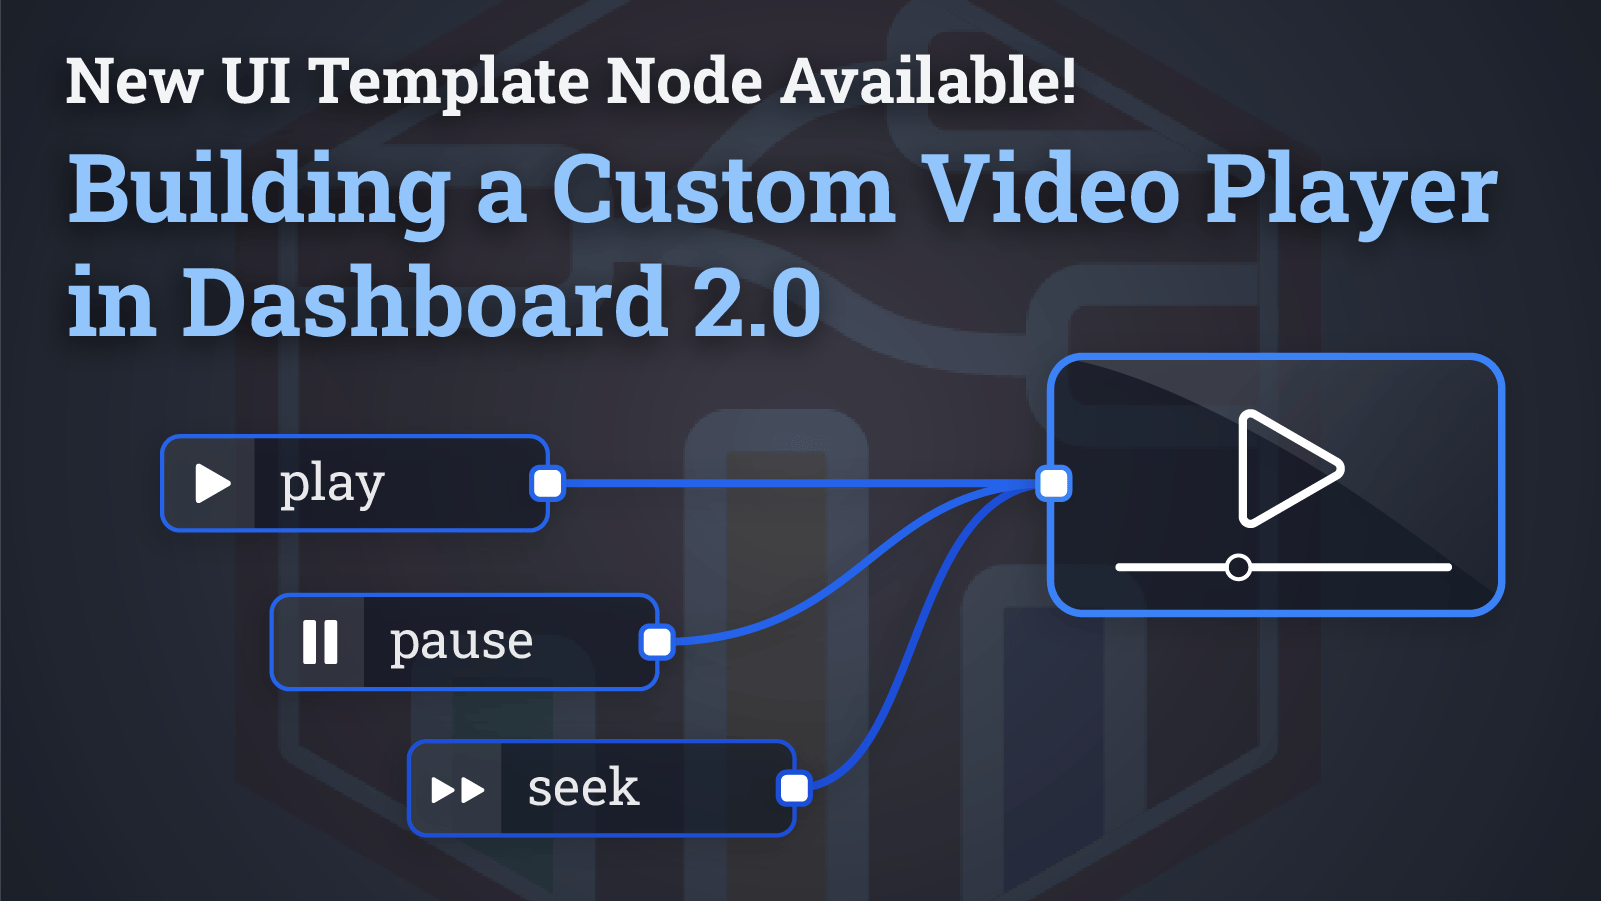
Building a Custom Video Player in Dashboard 2.0
Delve into the possibilities of Dashboard 2.0's new UI Templates with a comprehensive tutorial on building a custom video player.
Overhauling the Dashboard 2.0 Build Pipeline
Explore the latest updates in Dashboard 2.0 with the 0.8.0 release, featuring an overhauled build pipeline, improved debugging capabilities, and more.
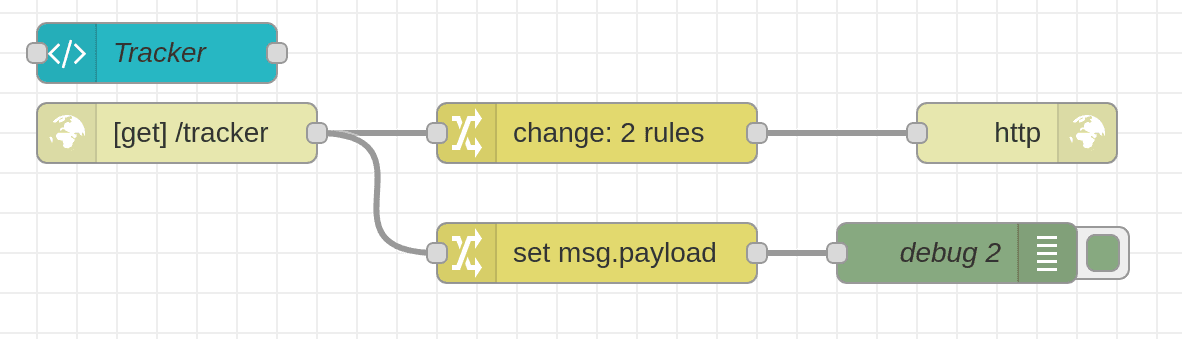
Tracking Who Has Opened a Dashboard
Learn how to track user visits to your Node-RED Dashboard v2 using FlowFuse Authentication. Secure access and identify users accessing your dashboard with this implementation.
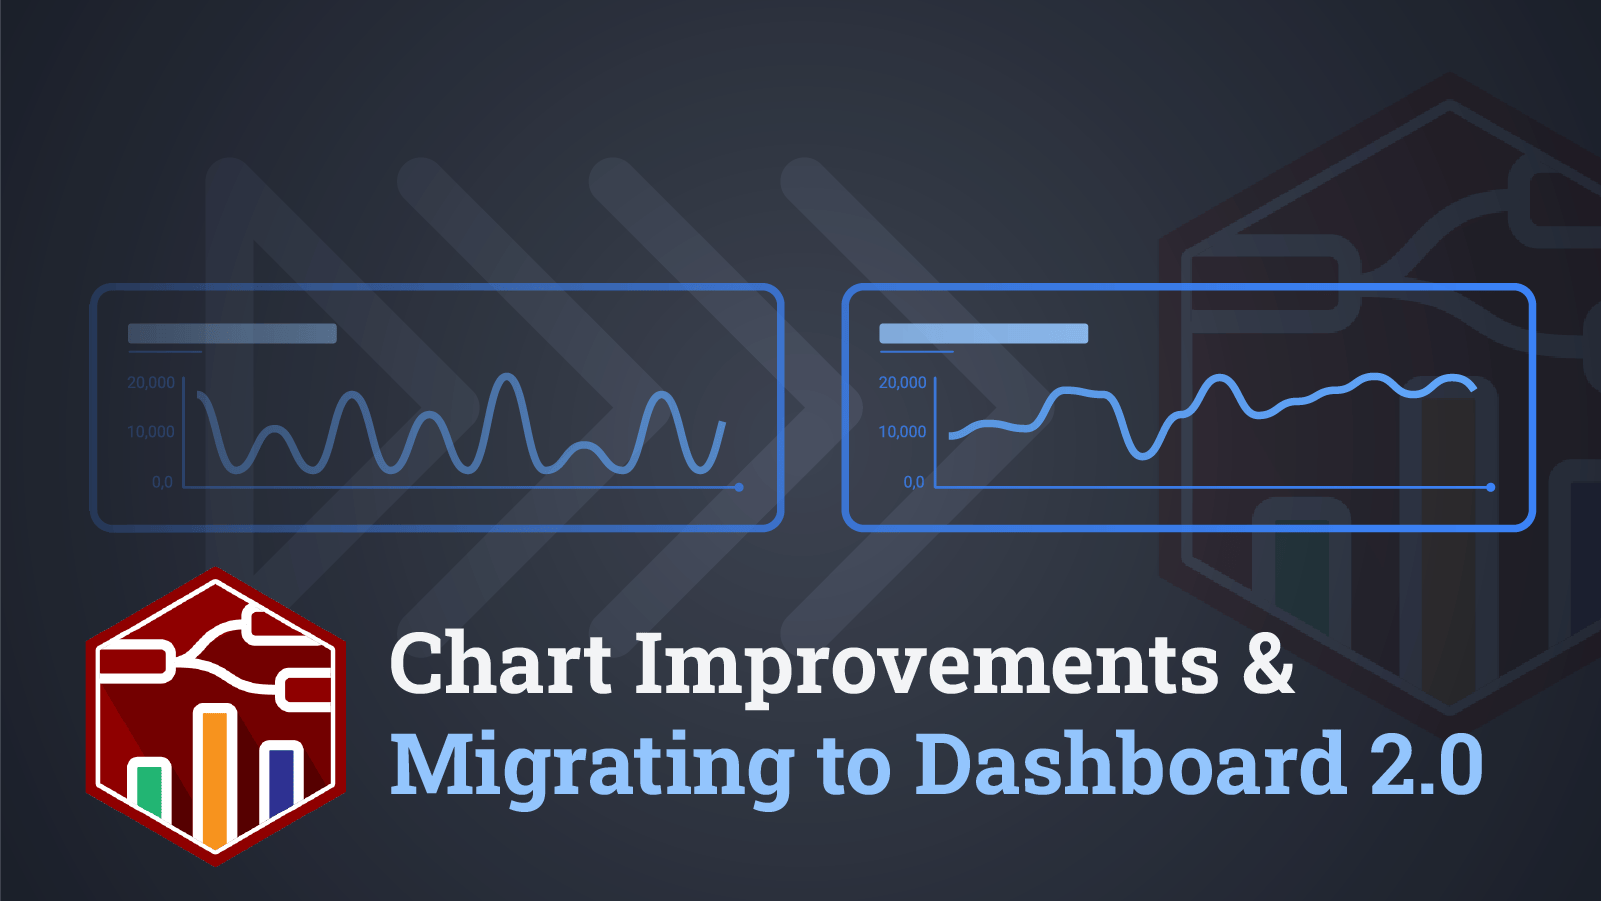
Chart Improvements & Migrating to Dashboard 2.0
Discover significant chart enhancements and migration guidance in Dashboard 2.0's 0.7.x releases. Stay informed on project updates.
Integrate your own widgets with Dashboard 2.0
Explore Dashboard 2.0's 0.6.0 Release with third-party widget support. Learn more, build your widgets, and join our community on GitHub.

Custom Vuetify components for Dashboard 2.0
Expand your dashboard with the full collection of Vuetify components
Dynamic Markdown, Tables & Notebooks with Dashboard 2.0
Explore the latest features in Dashboard 2.0's v0.4.0 release, including "Notebook" layout, dynamic Markdown & Table widgets, and additional enhancements.
Dashboard 2.0 - Community Update
Our latest Community Update for Dashboard 2.0, including the latest new widgets, fixes and updates on what's next.
First Pre-Alpha Release of the new Node-RED Dashboard
The first release of the successor to the Node-RED Dashboard has arrived, marking the beginning of the pre-alpha phase.

How to add images to Node-RED dashboards when using FlowFuse (2026)
Learn to enhance Node-RED dashboards with images using FlowFuse. Pull images from URLs, store locally, and serve them in your dashboards.
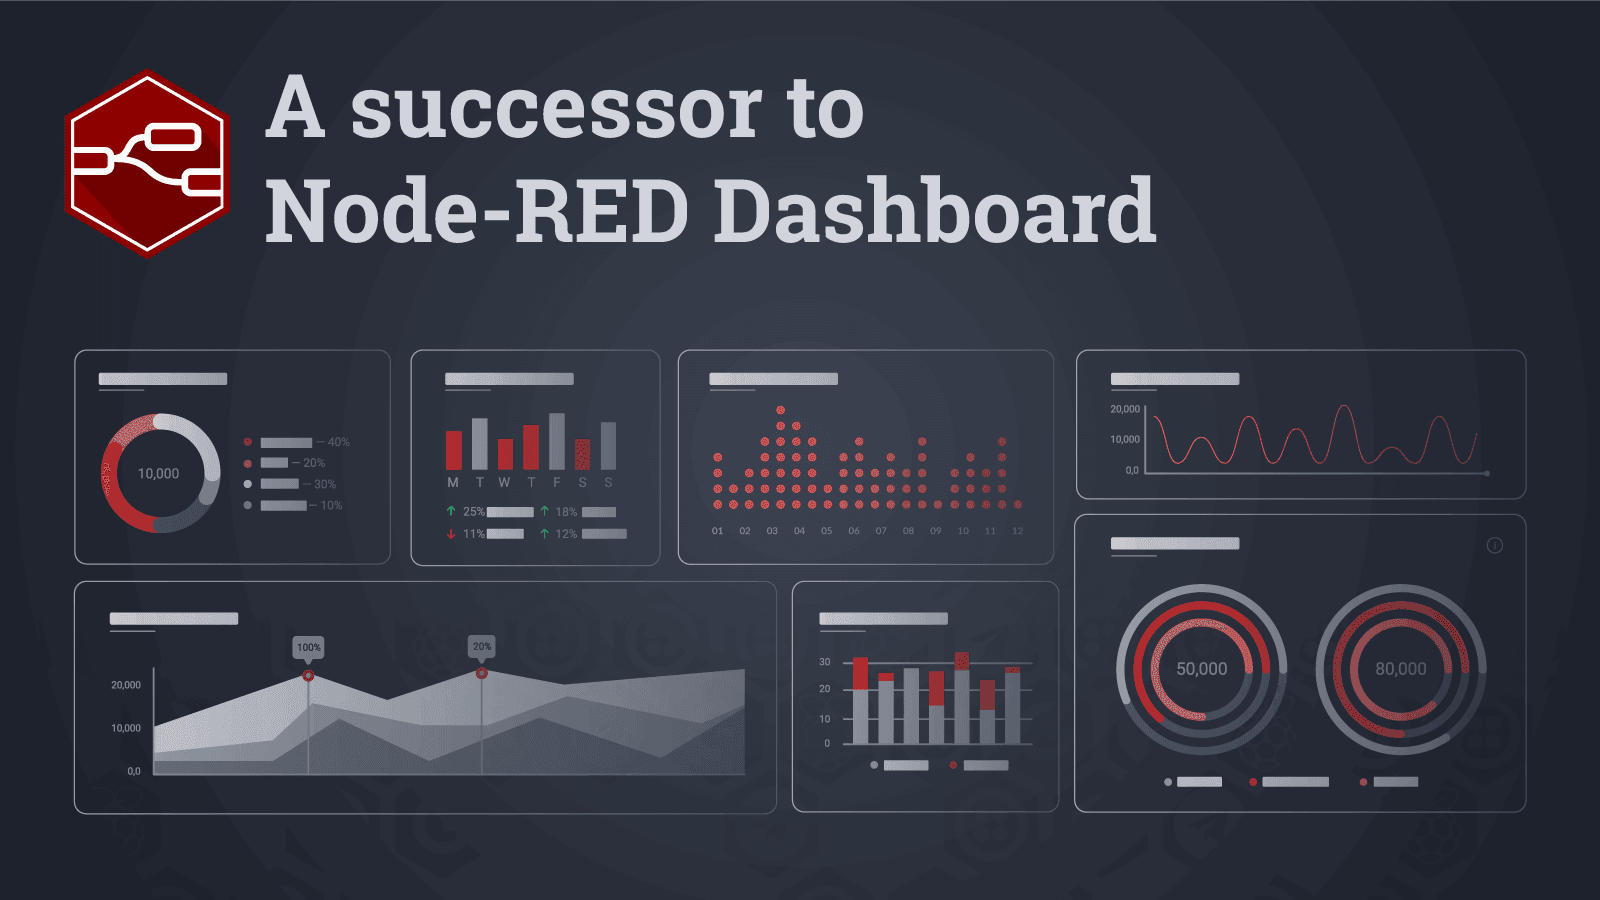
The Next Step in Data Visualization - Announcing the Successor to the Node-RED Dashboard
This article unveils FlowFuse's plans to build the successor to the Node-RED Dashboard.
Node-RED Tips - Dashboard Edition
Learn three practical tips for improving your Node-RED Dashboard workflow, such as creating responsive layouts, adding multiple data series to charts, and persisting slider values.
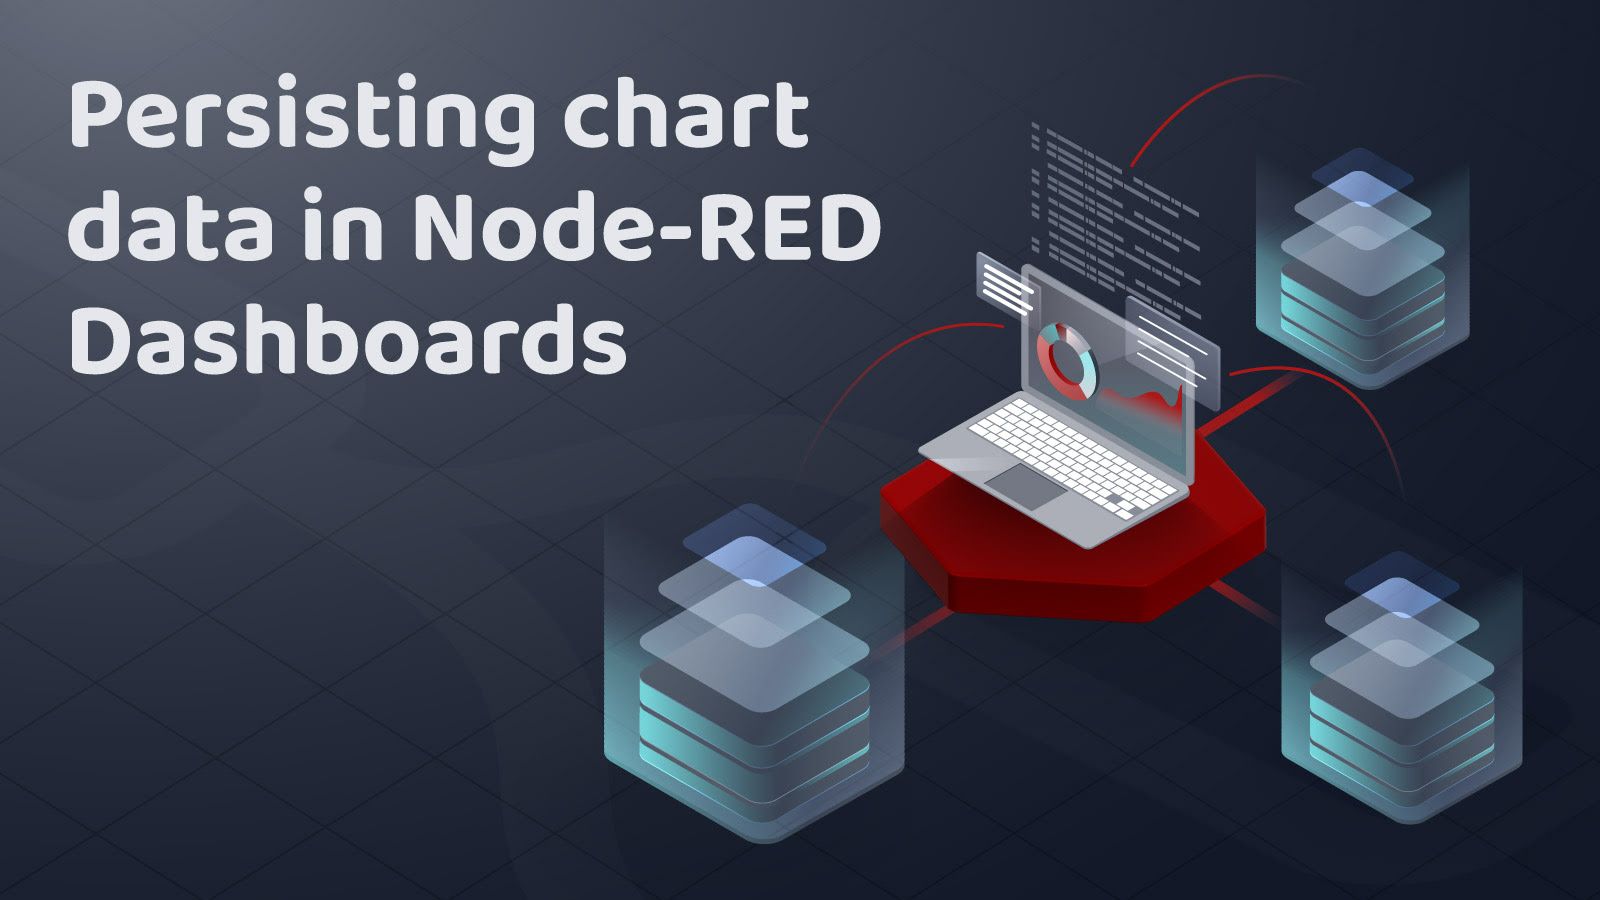
Persisting chart data in Node-RED Dashboard 1
Chart data in Node-RED can be stored directly in your flows but it's a good idea to also store data eleswhere. In this article we are looking at some easy ways to persist your historic chart data in Dashboard 1
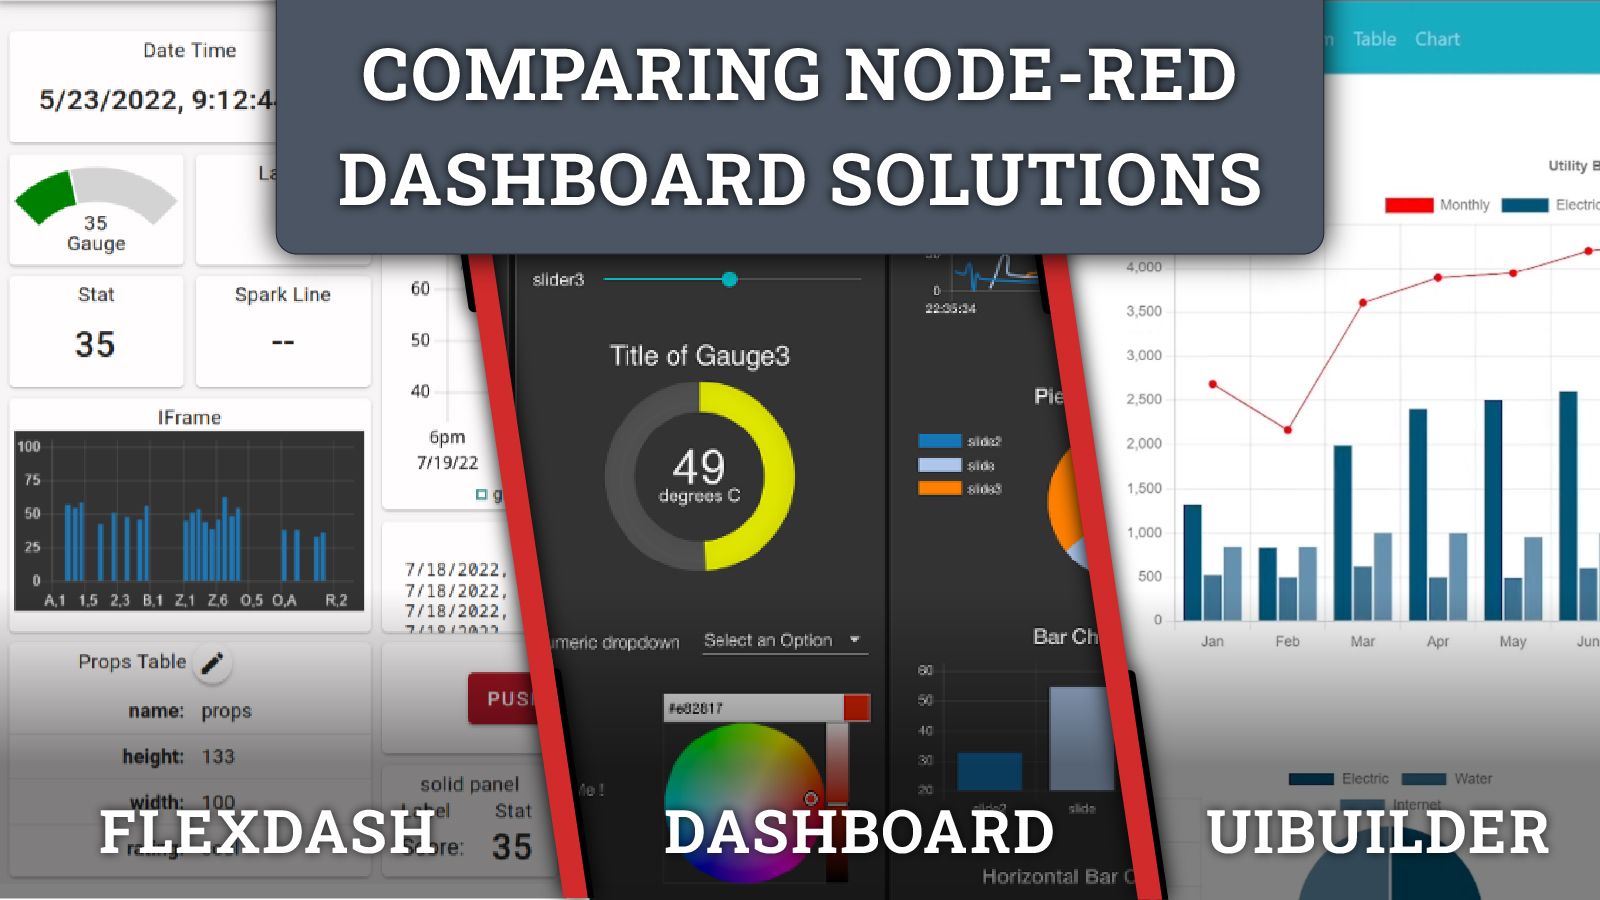
Comparing Node-RED Dashboards Solutions
Explore a thorough comparison of Node-RED dashboard solutions, covering installation, UI elements, support, and future development plans.